OpenTelemetry Support in Mule Runtime
OpenTelemetry is an observability standard consisting of specifications, APIs, and SDKs. It helps you instrument, generate, collect, and export telemetry data, such as metrics, logs, and traces, to analyze software behavior.
OpenTelemetry enables Mule runtime engine to provide observability into the behavior of Mule applications. With tracing context propagation, Mule also brings observability to interactions between Mule apps and non-Mule components that leverage this standard.
Mule supports generating and exporting OpenTelemetry traces, logs, and metrics.
Before You Begin
To use the OpenTelemetry Mule features, you must be familiar with:
-
Distributed tracing concepts, including traces and spans.
If you’re new to distributed tracing and OpenTelemetry, we recommend starting with What is OpenTelemetry and Understanding distributed tracing.
-
How to export telemetry data to third-party monitoring systems.
Before starting with the observability standard, you must have:
-
For traces and logs, Mule runtime 4.11.0 or later.
-
For metrics, Mule runtime 4.12.0 or later.
-
For OpenTelemetry tracing context propagation, Anypoint Connector for HTTP (HTTP Connector) 1.8 or later.
-
Mule runtime Direct Telemetry Stream.
|
Direct Telemetry Stream is available only for Advanced and Titanium tiers of MuleSoft Anypoint Platform. |
Tracing a Mule Application
Mule leverages OpenTelemetry to provide:
-
Application execution observability
Tracing a Mule runtime application allows you to observe its execution while maintaining the mental model of a Mule engineer. Its main objective is to clearly show how the Mule application processes messages, helping you to develop, monitor, and troubleshoot more effectively.
-
Distributed tracing
Tracing also enables you to track Mule application interactions. When multiple systems and services are involved, distributed tracing tracks requests as they flow through distributed environments, providing a comprehensive view of the overall execution.
Distributed tracing is achieved via the tracing context propagation. For example, if an HTTP Listener receives W3C Trace Context headers, the flow span in Mule acquires the client’s remote parent span, the span where the HTTP call originated. Mule automatically propagates the current span to the server endpoints when using the HTTP Requester component.
The span context format supported for receiving and propagating the context is the W3C Trace Context format.
Mule Span Data
A trace is a sequence of spans representing a complete operation in a distributed system. Spans can be nested and represent a unit of work or operation. Each span includes:
| Categories | Description | Example Values |
|---|---|---|
Name |
Name of the span |
|
Parent Span ID |
Span ID of current span’s parent |
|
Start and End Timestamps |
Earliest and latest timestamp for a span |
|
Span Context |
Data that uniquely identifies the span: trace ID, span ID, trace flags, and trace state |
|
Attributes |
Key-value pairs containing metadata used to annotate a span to carry information about the operation it’s tracking. |
{ “location”: “flow/processors/2”, “correlation.id”: “1234abcd” } |
Span Events |
A structured log message or annotation on a span, used to denote a meaningful, unique point in time during the span’s duration. |
{ "name": "", "message": "OK", "timestamp": "2021-10-22 16:04:01.209512872 +0000 UTC" } |
Span Links |
Links that associate one span with one or more spans, indicating a causal relationship. |
|
Span Status |
Status attached to a span. You can set a span status when a known error, such as an exception, occurs in the app code. |
|
Span Kind |
Information about how the trace is assembled. |
|
Example of Flow Tracing Feature
When tracing a flow execution, each Mule component execution involved in processing the message is represented as a span. The component spans describe the relevant aspects of the execution. They can range from a single span for a simple component, such as the Set Payload, to more complex structures, such as a Batch Job.
The Mule runtime traces complex components, such as Batch Jobs.
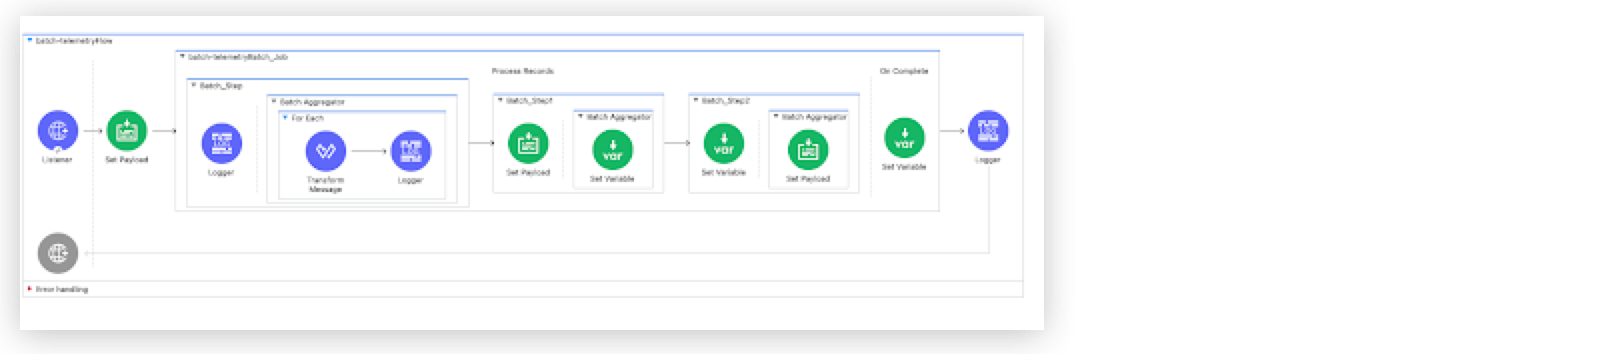
The trace shows how the first step of the Batch Job processes each batch record, with each record span containing a child span that represents the unit of work the Logger component performs. Next, it displays the Batch Aggregator span, along with the For Each component and the processors within it, such as Transform Message and Logger. Then, the trace displays the other two batch steps and their respective components. Finally, it shows the Batch On Complete span, along with the Logger component that appears after the Batch Job in the flow.
Example of Tracing Context Propagation Feature
In this example, one Mule app sends a request to another Mule app:
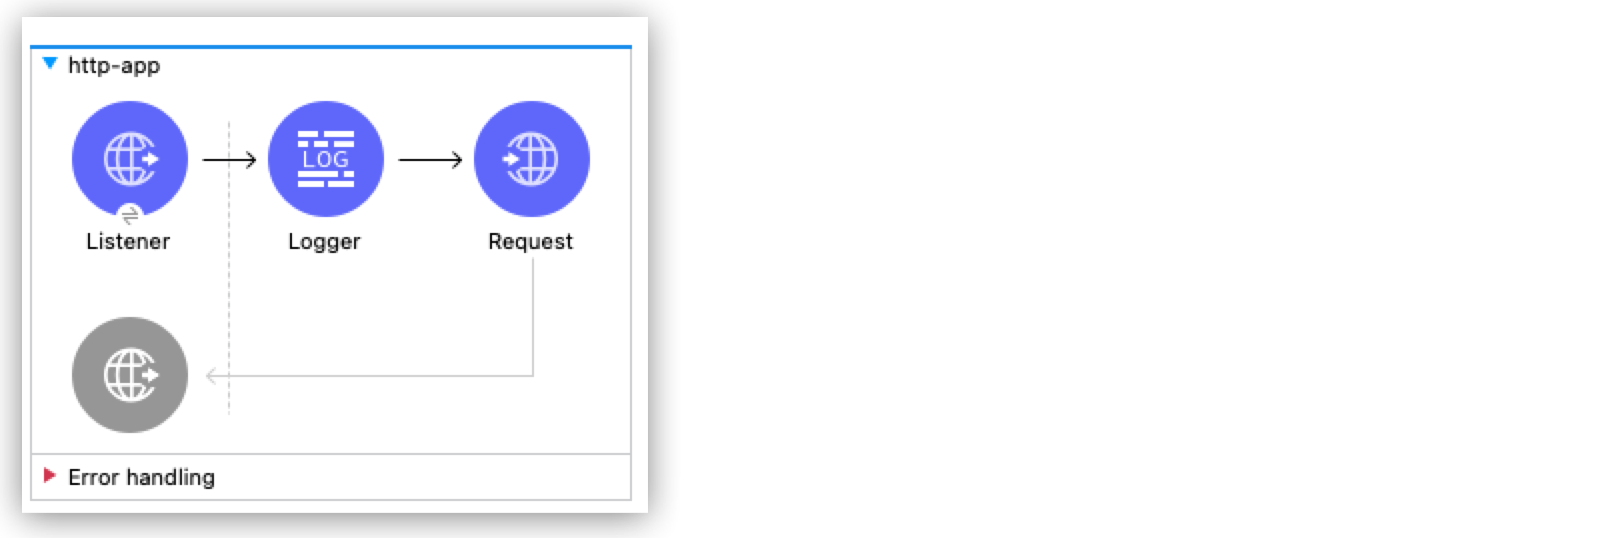
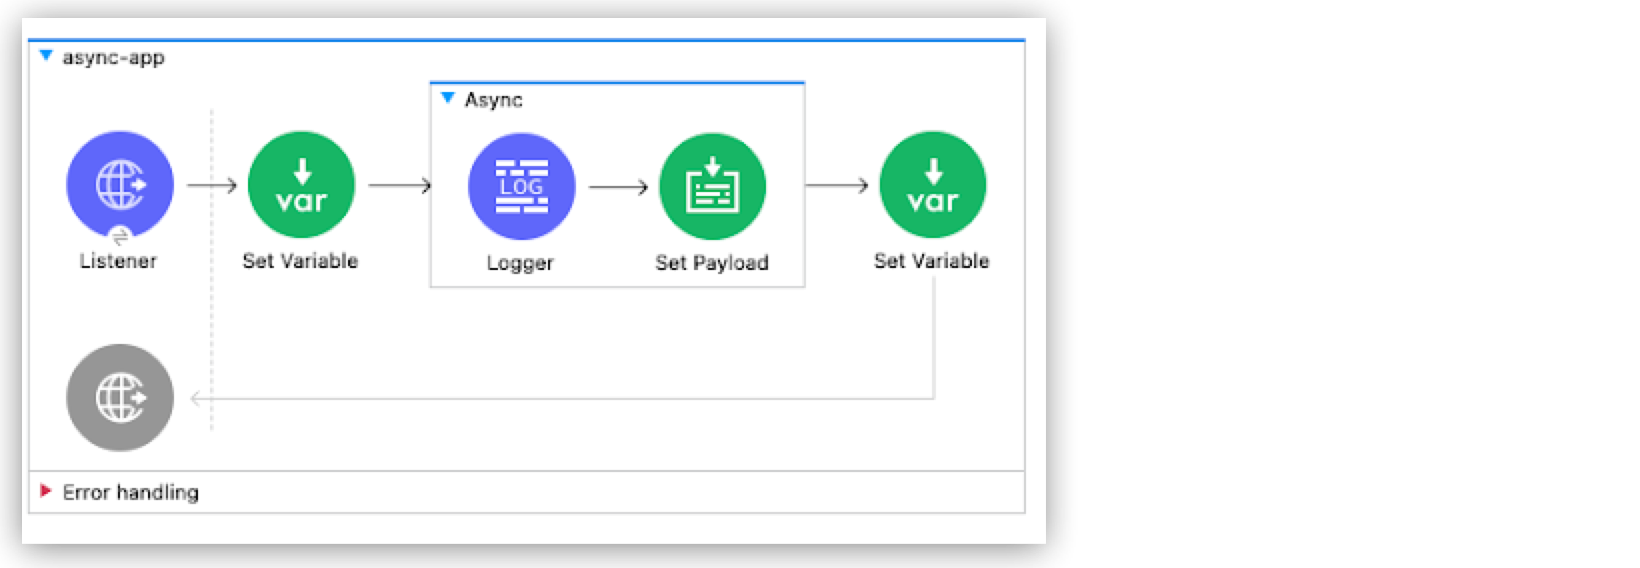
Distributed tracing captures both flows as part of the same trace because OpenTelemetry is instrumented in Mule and HTTP Connector.
Mule Errors in Tracing
If the execution of the unit of work represented by a span produces an error, the span’s status is set to Error. MuleSoft follows the semantic convention defined by OpenTelemetry that adds one or more exception events to the span:
-
exception.type: Mule error type -
exception.message: Mule error message -
exception.stacktrace: Mule flow stack string representation
In this example, when an error is produced, the span corresponding to the Raise Error component has an Error status:
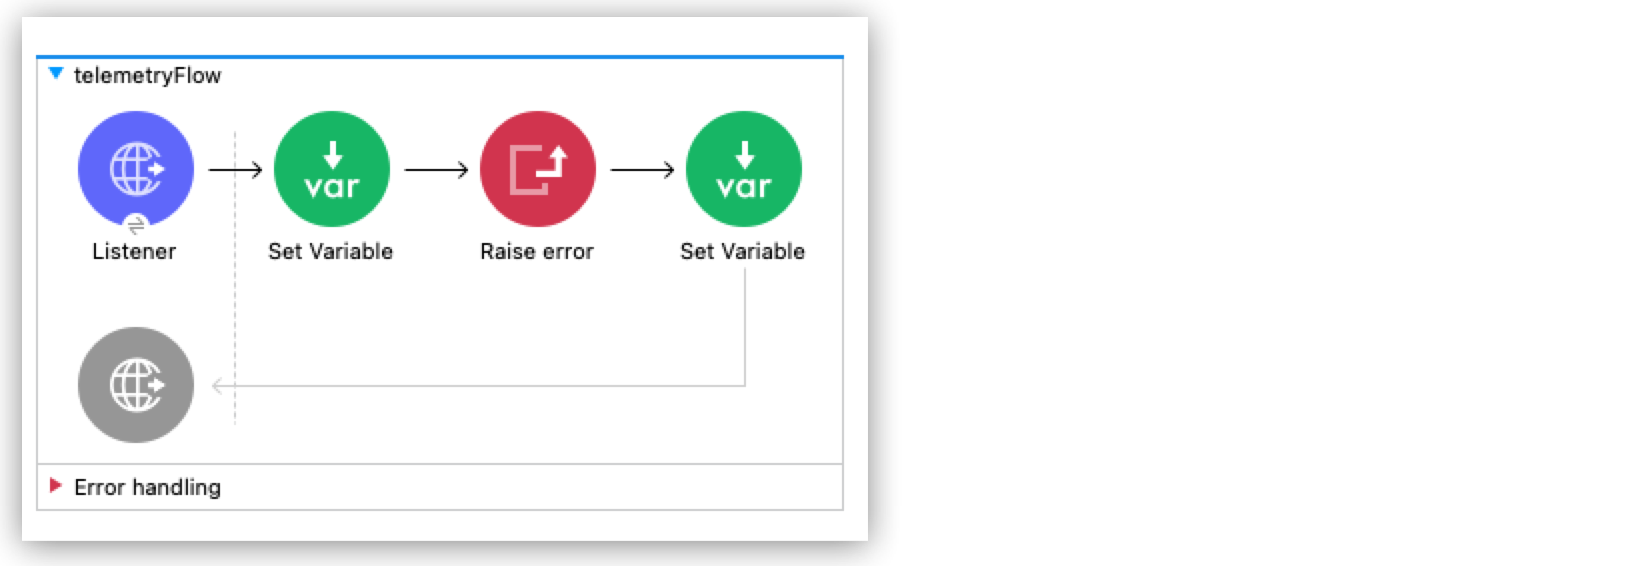
Because this flow lacks error handling, the error propagates and fails the flow execution, causing the Error status to propagate to the flow span. A detailed view of the span also shows the associated exception events.
HTTP Conventions
The HTTP Listener and HTTP Request operations contribute additional attributes to the spans, providing more context for tracing the HTTP interactions.
For flows with an HTTP Listener:
-
Span name: Combination of HTTP Method and path. For example,
POST /api. -
Span kind:
SERVER.
Additional attributes for an HTTP Listener associated flow span:
| Attribute | Description |
|---|---|
|
Host address of the HTTP Listener |
|
Port of the HTTP Listener |
|
User agent of the received request |
|
Path of the HTTP Listener |
|
HTTP method |
|
HTTP version |
For flows with an HTTP Request:
-
Span name: HTTP Method. For example,
GET. -
Span kind:
CLIENT.
Additional attributes for an HTTP Request associated flow span:
| Attribute | Description |
|---|---|
|
Target URL |
|
Port of the HTTP Request |
|
Target IP address |
|
Path of the HTTP Request |
|
HTTP version |
OpenTelemetry Logs
Mule runtime implements its logging by leveraging Log4j, where you can configure appenders and logging levels to send logs to different destinations.
The OpenTelemetry logging export is implemented along with Log4j logging. This means you can configure OpenTelemetry logging export on top of your existing logging setup. This flexible architecture doesn’t force a full transition to OpenTelemetry.
Exported logs include application, domain, and Mule runtime server logs.
Mule Log Record Data
OpenTelemetry logging is a sequence of log records with a unified data model, where each record corresponds to a Java log call. Each log record contains:
| Categories | Description | Example Values |
|---|---|---|
Timestamp |
Time of the Java log call |
|
Observed Timestamp |
Time of the OpenTelemetry log event registration |
|
Trace ID |
Trace where the log event originated. Not present if the log occurred outside an application trace. |
|
Span ID |
Span where the log event originated. Not present if the log occurred outside an application trace. |
|
Trace Flags |
W3C trace flags corresponding to the trace where the log event originated. Not present if the log occurred outside an application trace. |
|
Severity Text |
Severity of the log event. Mule maps this value to the equivalent Log4j level during export. |
|
Body |
Body of the log record. Also known as log message. |
|
Instrumentation Scope |
Fully qualified name of the Java class where the Java log call originated |
|
Attributes |
Key-value pairs that annotate a log record with context metadata. Includes Log4j MDC entries. |
|
MDC Propagation
Any entry added to the Log4j MDC is added to the OpenTelemetry logs as Log Record attributes, so all Log4j MDC data is exported as part of OpenTelemetry logs.
For adding custom attributes on both traces and logs, see Custom Attributes.
Correlation with Traces
-
When using OpenTelemetry logs:
OpenTelemetry Log Records include fields for the trace ID and span ID. When tracing is enabled, Mule runtime exports OpenTelemetry logs that include these values, enabling correlation between application traces and logs.
-
When using Log4j logs:
If you export traces only, Mule runtime still adds the trace ID and span ID to the Log4j MDC under the keys
trace_idandspan_id.
OpenTelemetry Metrics
Metrics provide visibility into the health and operational performance of the Mule runtime, Mule applications and the Direct Telemetry Stream export.
Message Processing Metrics
Instrumentation scope: `org.mule.runtime.flow.statistics`
These metrics track message throughput and processing errors at the flow level. They reflect the core message and response lifecycle of a Mule application.
| Metric | Type | Description |
|---|---|---|
|
Counter |
Total number of messages dispatched by sources for flow processing. |
|
Counter |
Total events received by flows for processing. |
|
Counter |
Errors encountered during flow processing. |
|
Counter |
Unrecoverable errors that terminated flow processing. |
These metrics are useful for understanding application throughput and detecting error rate trends over time.
Flow Inventory Metrics
Instrumentation scope: `org.mule.runtime.flow.statistics`
These metrics provide a snapshot of the application’s flow topology. They report how many flows of each category are declared in the application configuration and how many are currently active (started).
| Metric | Type | Description |
|---|---|---|
|
Counter |
Number of flows with message sources (HTTP listeners, schedulers, etc.) |
|
Counter |
Trigger flows currently in a started state. |
|
Counter |
Number of sub-flows and private flows (no message source). |
|
Counter |
Private flows currently in a started state. |
|
Counter |
Number of flows generated by APIKit from an API specification. |
|
Counter |
APIKit flows currently in a started state. |
Error Metrics
Instrumentation scope: `org.mule.runtime.errors`
These metrics break down runtime errors by their Mule error type, providing more granular error visibility than the aggregate execution.errors counter.
| Metric | Type | Attributes | Description |
|---|---|---|---|
|
Counter |
|
Count of errors classified by Mule error type |
The error-type attribute contains the Mule error identifier (e.g., MULE:COMPOSITE_ROUTING, HTTP:NOT_FOUND, MULE:SOURCE_RESPONSE_SEND), enabling per-type trend analysis and alerting.
error-count and execution.errors are tracked independently. execution.errors can report a higher total because it counts all execution-level errors, including those not classified into a specific error type.
|
Runtime Alerts Metrics
Instrumentation scope: `org.mule.runtime.diagnostics`
These metrics expose the Mule runtime built in alerting system, tracking operational conditions that may require attention.
| Metric | Type | Attributes | Description |
|---|---|---|---|
|
Counter |
|
Number of runtime alerts triggered |
Known alert types:
| Alert Name | Description |
|---|---|
|
The OpenTelemetry export queue reached capacity, causing telemetry data to be delayed or dropped |
|
The Log4j async logger ring buffer is full, indicating logging backpressure |
The mule.alert.context attribute provides additional detail about the alert (e.g., Resource: log records, Action: delayed).
JVM Metrics
Instrumentation scope: `io.opentelemetry.runtime-telemetry`
Standard OpenTelemetry JVM instrumentation metrics providing visibility into the underlying Java Virtual Machine.
| Metric | Type | Description |
|---|---|---|
|
Gauge |
Current memory usage by pool (heap/non-heap) |
|
Gauge |
Memory committed by the JVM per pool |
|
Gauge |
Maximum memory available per pool |
|
Gauge |
Memory used after the most recent GC |
|
Histogram |
Garbage collection pause durations by GC name |
|
Gauge |
Active threads by state |
|
Gauge |
Currently loaded classes |
|
Counter |
Total classes loaded since JVM start |
|
Counter |
Total classes unloaded since JVM start |
|
Gauge |
Available processors |
|
Gauge |
Recent CPU utilization (0.0 to 1.0) |
|
Counter |
Cumulative CPU time consumed |
Direct Telemetry Stream Exporter Metrics
Instrumentation scopes: io.opentelemetry.exporters.otlp_grpc_span_exporter, io.opentelemetry.exporters.otlp_grpc_log_exporter, io.opentelemetry.exporters.otlp_grpc_metric_exporter, io.opentelemetry.sdk.metrics, io.opentelemetry.sdk.trace, `io.opentelemetry.sdk.logs`
These metrics show the health and throughput of the Direct Telemetry Stream exporters so you can monitor the export of the telemetry data.
Export Throughput
| Metric | Type | Description |
|---|---|---|
|
Counter |
Number of spans for which export has finished (successful or failed) |
|
Counter |
Number of log records for which export has finished. |
|
Counter |
Number of metric data points for which export has finished. |
Export Backpressure
| Metric | Type | Description |
|---|---|---|
|
Gauge |
Spans passed to the exporter but not yet exported. |
|
Gauge |
Log records passed to the exporter but not yet exported. |
|
Gauge |
Metric data points passed to the exporter but not yet exported. |
Export Performance
| Metric | Type | Description |
|---|---|---|
|
Histogram |
Duration of exporting a batch of telemetry records (in seconds) |
|
Histogram |
Duration of the metric reader’s collect operation (in seconds) |
Batch Processing
| Metric | Type | Description |
|---|---|---|
|
Counter |
Number of spans processed by the |
|
Counter |
Number of log records processed by the |
|
Gauge |
Number of items currently queued in the batch processor |
Direct Telemetry Stream from Mule Runtime
|
This feature is available only for Advanced and Titanium tiers of MuleSoft Anypoint Platform. |
Starting with Mule runtime 4.11.0, you can export OpenTelemetry traces and logs outside Anypoint Monitoring. This allows Mule runtime to export its OpenTelemetry data to a customer-managed OpenTelemetry collector instead of the Anypoint Monitoring OpenTelemetry pipeline.
This solution uses a shared responsibility model. Size your environment to support telemetry export. Sizing depends on factors such as Mule app and third-party observability platform performance. Test to discover additional factors.
When using this direct telemetry stream feature, Anypoint Monitoring OpenTelemetry features, such as Telemetry Exporter, aren’t available.
Recommended Architecture for Direct Telemetry Stream
Mule runtime supports exporting all its telemetry data using the OpenTelemetry protocol (OTLP) and binary/protobuf format. You can configure an endpoint for each signal type (traces, logs, and metrics), and data is sent to that endpoint. However, we strongly recommend using a collector because it provides the most flexible and feature-rich architecture for a wide range of use cases and deployment scenarios.
See OpenTelemetry Collector for more information.
Key reasons for using a collector include:
-
Compatibility
Mule runtime sends telemetry signals to one endpoint (the collector) in one (OTEL binary/protobuf) format, ensuring vendor neutrality. Then, the collector manages exporting signals to the selected backends. This is especially useful for monitoring solutions like Azure, which can’t ingest OTEL signals directly and require a specific exporter, or Grafana, which implements authentication and additional metrics via collector components.
Exporting the same signal to multiple third-party solutions is only possible through a collector because Mule runtime allows one endpoint per signal.
Most third-party monitoring solutions support or provide their own collector implementations.
-
Security
Applications don’t need external Internet access to reach third-party monitoring solutions.
The collector handles authentication and authorization against third-party monitoring solutions. You can use it as a single point for dedicated network policies.
-
Performance
You can optimize collectors for specific goals, scale independently, and distribute load without affecting Mule runtime instances. Configuration changes don’t affect Mule runtime instances.
-
Observability
Collectors include multiple built-in metrics and health checks.
-
Centralize data processing
A collector can centralize data enrichment and transformation for Mule runtime telemetry and additional non-Mule services.
Direct Telemetry Stream Configuration
Mule runtime includes predefined configuration templates for exporting traces and logs.
Hybrid Standalone Deployment
Configure hybrid instances by using Runtime Manager hybrid server properties instead of Java system properties.
Additionally, you can configure a limited set of options at the application level by using application deployment properties. This configuration is limited to a subset of the available settings.
-
mule.openTelemetry.exporter.resource.service.name -
mule.openTelemetry.exporter.resource.service.namespace
-
mule.openTelemetry.tracer.exporter.sampler.type -
mule.openTelemetry.tracer.exporter.sampler.arg
-
mule.openTelemetry.exporter.tls.certificatesStrategy -
mule.openTelemetry.exporter.tls.certFileLocation -
mule.openTelemetry.exporter.tls.keyFileLocation -
mule.openTelemetry.exporter.tls.caFileLocation -
mule.openTelemetry.exporter.tls.certBase64 -
mule.openTelemetry.exporter.tls.keyBase64 -
mule.openTelemetry.exporter.tls.caBase64
CloudHub, CloudHub 2.0 and Anypoint Runtime Fabric Deployments
Configure these deployments by using Runtime Manager application properties.
Direct Telemetry Stream for Traces Configuration
Tracing export setup properties:
| Property | Default Value | Description |
|---|---|---|
|
|
Set to |
|
|
Endpoint where the traces are exported to. |
|
|
Transport type. Available values: |
|
Empty list |
Comma-separated list of headers included in every export call made to the export endpoint. Example: |
Tracing export tuning properties:
| Property | Default Value | Description |
|---|---|---|
|
|
Mule runtime tracing level. Available values: |
|
|
Head sampling strategy used. Available values: |
|
0.1 |
Argument for head sampling strategy. For example, sampling percentage for the |
|
10 Seconds |
Timeout for every export call made to the export endpoint. |
|
|
Compression algorithm used to compress the tracing data to be sent on every export call made to the export endpoint. Available values: |
|
5 |
Maximum retry attempts to export a batch of spans when the export endpoint responds with a retryable error. |
|
1 second |
Wait time before the first retry attempt. |
|
5 seconds |
Maximum wait time before a retry attempt. |
|
1.5 |
Multiplier applied to the last wait time before a new retry attempt. |
|
5000 milliseconds |
Maximum interval between two consecutive exports. |
|
2048 spans |
Export queue size. When full, non-fitting spans are handled according to the configured backpressure strategy. A |
|
512 spans |
Maximum size of batches exported per span. |
|
|
Strategy for handling full export queues. Available values: |
Minimal configuration example that exports 50% of the traces to an HTTP OpenTelemetry collector endpoint:
mule.openTelemetry.tracer.exporter.enabled=true
mule.openTelemetry.tracer.exporter.type=HTTP
mule.openTelemetry.tracer.exporter.endpoint=https://your-collector.com/api/v1/traces
mule.openTelemetry.tracer.exporter.sampler.arg=0.5
The mule.openTelemetry.tracer.exporter.sampler.arg represents the percentage of sampling where 0.1 is 10% and 1 is 100%.
|
Direct Telemetry Stream for Logs Configuration
Logging export setup properties:
| Property | Default Value | Description |
|---|---|---|
|
|
Set to |
|
|
Endpoint for exporting logs. |
|
|
Transport type. Available values: |
|
Empty list |
Comma-separated list of headers included in every export call made to the export endpoint. Example: |
Logging export tuning properties:
| Property | Default Value | Description |
|---|---|---|
|
|
Minimum severity level to export. Mule doesn’t send log records below this level to the export endpoint. Available values: |
|
10 Seconds |
Timeout for every export call made to the export endpoint. |
|
|
Compression algorithm used to compress the logging data to be sent on every export call made to the export endpoint. Available values: |
|
5 |
Maximum retry attempts to export a batch of log records when the export endpoint responds with a retryable error. |
|
1 second |
Wait time before the first retry attempt. |
|
5 seconds |
Maximum wait time before a retry attempt. |
|
1.5 |
Multiplier applied to the last wait time before a new retry attempt. |
|
5000 milliseconds |
Maximum interval between two consecutive exports. |
|
2048 log records |
Export queue size. When full, non-fitting log records are handled according to the configured backpressure strategy. A |
|
512 log records |
Maximum size of batches exported per log record. |
|
|
Strategy for handling full export queues. Available values: |
|
Use For example, to export With |
Minimal configuration example that sends logs to an HTTP OpenTelemetry collector endpoint:
mule.openTelemetry.logging.exporter.enabled=true
mule.openTelemetry.logging.exporter.type=HTTP
mule.openTelemetry.logging.exporter.endpoint=https://your-collector.com/api/v1/logs
mule.put.trace.id.and.span.id.in.mdc=true
Setting the mule.put.trace.id.and.span.id.in.mdc property to true won’t be necessary in future releases because Mule runtime will automatically enable it.
|
Direct Telemetry Stream for Metrics Configuration
Metrics export setup properties:
| Property | Default Value | Description |
|---|---|---|
|
|
Set to |
|
|
Endpoint for exporting metrics. |
|
|
Transport type. Available values: |
|
Empty list |
Comma-separated list of headers included in every export call made to the export endpoint. Example: |
|
|
Set to |
Metrics export tuning properties:
| Property | Default Value | Description |
|---|---|---|
|
60 Seconds |
Timeout for every export call made to the export endpoint. |
|
10 Seconds |
Timeout for every export call made to the export endpoint. |
|
|
Compression algorithm used to compress metric data sent on every export call made to the export endpoint. Available values: |
|
5 |
Maximum retry attempts to export a metrics measurement when the export endpoint responds with a retryable error. |
|
1 second |
Wait time before the first retry attempt. |
|
5 seconds |
Maximum wait time before a retry attempt. |
|
1.5 |
Multiplier applied to the last wait time before a new retry attempt. |
Metrics Temporality
Mule runtime exports all its metrics using cumulative temporality. Each exported data point represents the total accumulated value of a metric since the application started, not just the delta since the last export.
If an export fails (including after backpressure retries), that export cycle is dropped without being queued or persisted. Because metrics are cumulative, a dropped export doesn’t result in permanent data loss. The next successful export carries the full accumulated state, and the backend service reconstructs the timeline with only a brief gap in resolution.
If the Direct Telemetry Stream exporter is still engaged in a previous metric export cycle when the next interval fires, the new cycle is skipped and a "Exporter busy. Dropping metrics." INFO log message is triggered. To minimize skipped cycles, keep your collector and backend service reachable with low latency.
Advanced Features
This section describes advanced features that are available for OpenTelemetry support in Mule runtime.
Tracing Sampling
Sampling helps reduce observability costs. Mule runtime supports Head sampling, which makes the sampling decision as early as possible. In a Mule application, that moment is when a message source is about to trigger a message processing operation, for example, when an HTTP listener has received a request.
Head sampling is a good fit for:
-
Supporting use cases with limited budgets for observability.
-
Accommodating use cases when there isn’t a collector involved (consider early development stages) where observability is also useful.
While Head sampling is simple and efficient, it has limitations. It can’t:
-
Sample only traces that contain an error.
-
Sample traces based on overall latency.
-
Sample traces based on specific attributes on one or more spans in a trace, for example, sample more traces originating from a newly deployed service.
-
Apply different sampling rates to traces based on certain criteria, for example, traces from low-volume services versus high-volume services.
Tail sampling supports these advanced cases but is costly and can affect performance. Therefore, Mule runtime only supports Head sampling. If needed, implement Tail sampling in the OpenTelemetry collector.
Regarding sampling algorithms, Mule runtime currently supports these standardized OpenTelemetry algorithms: AlwaysOn, AlwaysOff, ParentBasedAlwaysOn, ParentBasedAlwaysOff, TraceIdRatio, and ParentBasedTraceIdRatio.
AlwaysOn
Samples 100% of traces. Every span is recorded and exported. This option is expensive in production due to high data volume.
AlwaysOff
Samples 0% of traces. No spans are recorded or exported. Use this option to completely disable tracing.
ParentBasedTraceIdRatio
A parent-aware sampler that:
-
Inherits the parent’s sampling decision if a parent span exists.
-
Uses ratio-based sampling (like
TraceIdRatio) if no parent span exists (root span).
This is the default and most commonly recommended sampler for production. It balances cost control through ratio-based sampling while preserving trace continuity across distributed services.
TraceIdRatio
Samples a configurable percentage of traces based on the trace ID. The decision is deterministic based on the trace ID, ensuring all spans within the same trace are consistently sampled or not.
Tracing Levels (Direct Telemetry Stream Only)
Mule runtime tracing is structured around three base tracing levels: OVERVIEW, MONITORING, and DEBUG.
Each generated span has an associated tracing level. Flow spans use the OVERVIEW level, flow component spans use the MONITORING level, and internal flow component execution spans (parameter resolution, connection obtention, among others) use the DEBUG level.
In most cases, the default tracing level is the best choice. Use DEBUG for troubleshooting.
Custom Resource Attributes
In OpenTelemetry, a resource represents the entity that produces telemetry data. Resource attributes are key-value pairs that identify that entity across systems and environments.
Mule runtime supports configuring fixed-value custom resource attributes that are attached to every exported trace and log batch.
| Property | Default Value | Description |
|---|---|---|
|
Empty list |
Comma-separated list of resource attributes included in every span and logs export batch. |
Custom Service Name and Service Namespace
Service attributes identify the source of the telemetry data, Mule applications in this case. Mule runtime supports setting the service.name and service.namespace properties to custom values:
| Property | Default Value | Description |
|---|---|---|
|
Artifact ID |
Service name used by the exporter for traces and logs. |
|
|
Service namespace used by the exporter for traces and logs. |
Additionally, a service.instance.id identifies the instance of the Mule application and is automatically generated as a unique identifier on each deployment or redeployment.
|
Custom Attributes
Adding custom data to the generated spans and log records can help with:
-
Adding business context, such as an order ID.
-
Adding user context, such as a user ID.
-
Enabling filtering and searching.
-
Improving troubleshooting by adding debug or troubleshooting data.
Mule runtime supports adding custom attributes to spans and log records through the Tracing Module.
Any logging variable set by the module is also added as an attribute of the span that represents the set-logging-variable operation and the spans and log records that are generated during the flow’s execution, including subflows, flow references, and error handlers.
While useful, custom attributes must be handled with care. Include only relevant information. Too many attributes can affect performance and reach the feature limits:
-
Maximum of 128 attributes per span (additional attributes are dropped)
-
Maximum length of 16384 bytes per attribute (exceeding bytes are truncated)
Backpressure Strategy
Backpressure occurs when export queues for traces or logs are full. Backpressure strategies define how Mule runtime handles this event:
-
DROPbackpressure strategy: When the queue is full, non-fitting spans or logs are dropped. This is the default strategy for traces. -
BLOCKbackpressure strategy: When the queue is full, this strategy blocks the call until space is generated at the export queue for non-fitting spans or log records. This is the default strategy for logs because it aligns with the Log4j behavior.
Dropping spans or log records results in missing data at the export destination. Blocking threads, on the other hand, can cause performance issues in Mule runtime.
For both conditions, Mule runtime generates a WARNING log. Internal statistics track historical occurrences, and the log messages include cumulative totals since the export started.
An alert is also triggered and is available at the Mule troubleshooting plugin DIAF files.
DROP backpressure warning (application log):Export queue overflow: 2 spans have been dropped. Total spans dropped since the export started: 4
BLOCK backpressure warning (application log):Export queue overflow: 2 spans have been delayed. Total spans delayed since the export started: 4
* OTEL_EXPORT_QUEUE_FULL      1 /   3 /    5 /    8
Details:
- Resource: spans, Action: drop (4 times)
- Resource: logs, Action: delay (4 times)
Retry Logic
When errors occur during export requests, Mule runtime uses an exponential backoff with jitter to avoid overwhelming the destination until recovery. Only errors marked as retryable, as defined by OpenTelemetry standards, trigger retry logic. See HTTP transport protocol reference and gRPC transport protocol reference for more information.
TLS support (Direct Telemetry Stream Only)
Direct telemetry stream supports configuring the export for traces and logs to use mutual TLS authentication, which can be used to secure the communication with an external collector.
| Property | Default Value | Description |
|---|---|---|
|
|
Set to |
|
|
The strategy used to load the certificates. It can also be set to |
CERTIFICATES_PATH strategy is supported for Standalone and Hybrid Standalone deployments. Configure the certificates location when using this strategy:
| Property | Default Value | Description |
|---|---|---|
|
- |
TLS certificate file path. |
|
- |
TLS certificate public key file path. |
|
- |
TLS certificate authority file path. |
CERTIFICATES_BASE64 strategy is supported for all the deployments. Encode the certificates in Base64 when using this strategy:
| Property | Default Value | Description |
|---|---|---|
|
- |
TLS certificate encoded in Base64. |
|
- |
TLS certificate public key encoded in Base64. |
|
- |
TLS certificate authority encoded in Base64. |
base64 -w 0 client.crt > client.crt.b64
Troubleshooting Direct Telemetry Stream
Logs
Mule runtime logs are the place to check for connection issues, export errors, and delayed or dropped traces and logs.
-
Connection issues log errors.
-
Export failures log errors.
-
Dropped or delayed exports log warnings.
Mule Diagnostics
Mule diagnostics provides information about delayed or dropped traces and logs and are useful for quick checks. Note that diagnostics are temporal and cover only the last 60 minutes.
Use diagnostics as a starting point and complement your analysis by reviewing the logs.
Recommendations
Use an OpenTelemetry collector configured to report its internal metrics. See Collector internal metrics for more information. Having a collector with that setup can greatly improve the troubleshooting capabilities while moving the hard limits of your particular setup from the 3rd party solution to your own infrastructure where full observability is possible.
Keep standard Log4j logging enabled, or at least a variation that continues to log errors, to allow troubleshooting. Without this, you won’t be able to troubleshoot OpenTelemetry log export failures.
Do a performance test of your application before enabling this feature in a production environment. While our performance tests did not show huge performance costs, Direct telemetry stream is not a zero cost feature and therefore must be tested.
Always consider the limits of your third-party solution and configure your exports accordingly. Mule runtime can’t compensate for poor downstream performance scenarios without compromising its own stability.
The most common cause of export errors, delays, or drops is a bottleneck in the ingestion pipeline (the OpenTelemetry Collector and the third-party solution). Make sure these components operate within acceptable performance limits.
Be aware that tuning changes, such as modifying the queue size, can impact Mule application performance. Test these changes carefully before applying them to production.