Viewing Reports in Anypoint Monitoring
View reports on Mule app performance and behavior across all apps in an environment. Reports help you maintain the expected level of service for your apps.
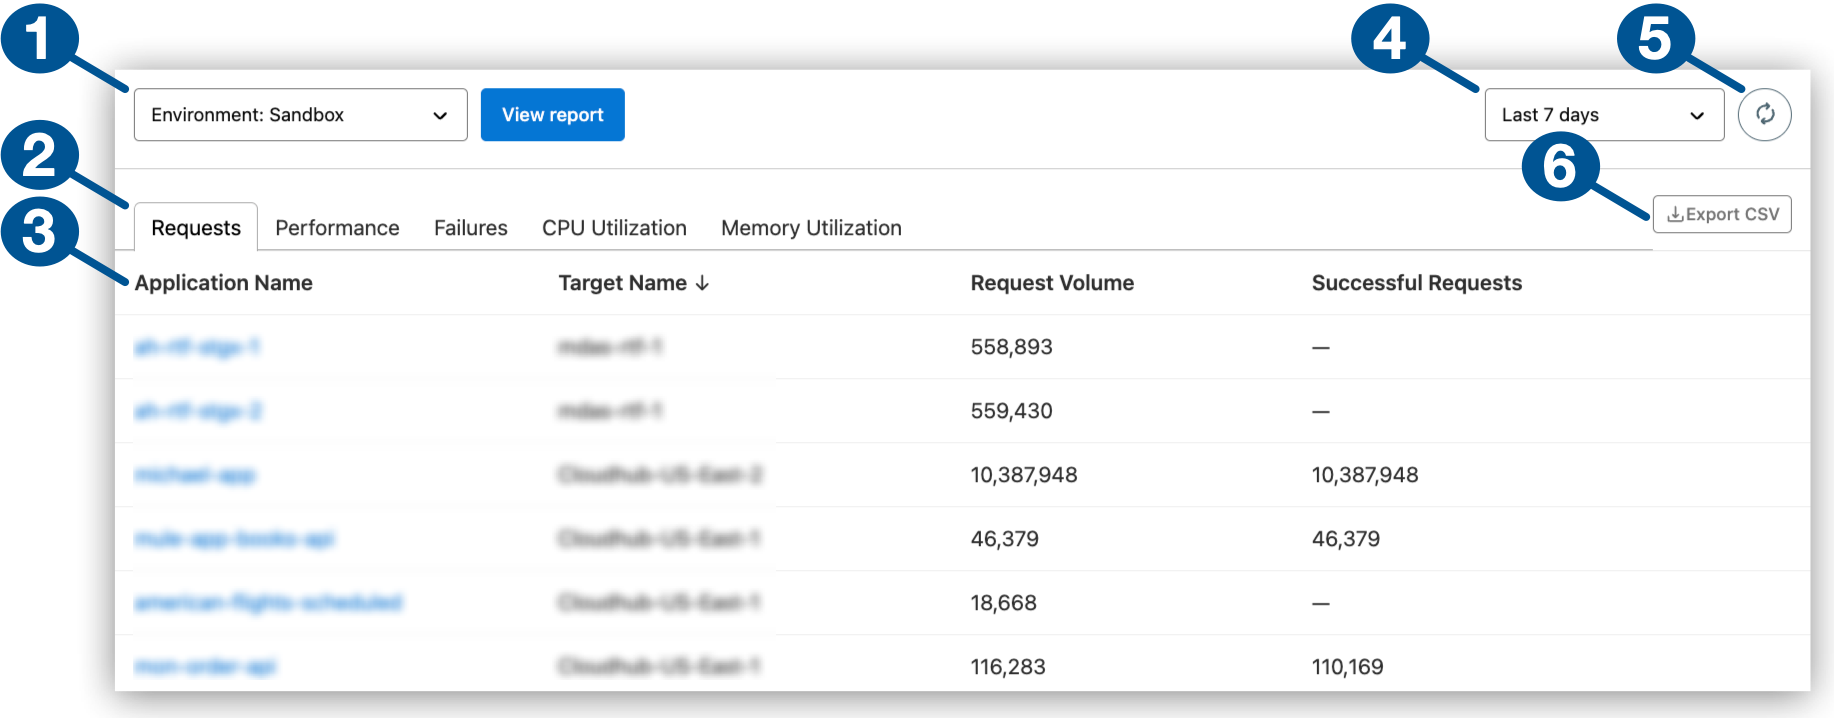
| 1 | Selects an environment for Mule apps, such as a production or sandbox environment.
In US and EU clouds only, the classic version of Anypoint Monitoring provides the environment selector on a separate page. |
||
| 2 | Displays reports:
|
||
| 3 | Lists apps you can click to get more details about the app:
|
||
| 4 | Sets a lookback period for the reports (24 hours and 7, 15, 30, and 90 days) | ||
| 5 | Manually refreshes report data | ||
| 6 | Downloads report data from the selected tab to CSV format |
Access Reports
-
Log in to Anypoint Platform with a user account that has permission to access Anypoint Monitoring content.
-
Navigate to Anypoint Monitoring:
Click Monitoring from the Anypoint Platform home page or from the Runtimes menu in the header.
-
In the sidebar, click Reports.
-
From Environment, select the environment where the apps you want to view are deployed.
-
Select the lookback period to view reports for that time range.
-
Click a report type:
Requests
Click the Requests tab to view information about app requests, including:
-
Request Volume: The total number of inbound requests to the app in the specified time range.
-
Successful Requests: The total number of successful inbound requests to the app within the specified time range.
Performance
Click the Performance tab to view information about app performance metrics, including:
-
Request Volume: The total number of inbound requests to the app in the specified time range.
-
Response Time: The average response time (in milliseconds) for inbound requests to the app.
Failures
Click the Failures tab to view information about app request failures, including:
-
Request Volume: The total number of inbound requests to the app in the specified time range.
-
Successful Requests: The number of successful inbound requests to the app in the specified time range.
-
Failed Requests: The total number of failed inbound requests to the app in the specified time range. An inbound request failure occurs when a Mule flow in your deployed Mule app throws an exception. Inbound failures differ from outbound failures, which indicate exceptions from outbound connector operations, such as from an HTTP Request operation in the Anypoint Connector for HTTP (HTTP Connector). Failure counts apply only to exceptions from the app, so a 4xx or 5xx reply code to a caller isn’t a failure unless the reply is due to an unmanaged exception.
CPU Utilization
Click the CPU Utilization tab to view information about the average percentage of the CPU utilized by the JVM.
| This tab isn’t available to apps in hybrid standalone deployments. |
Memory Utilization
Click the Memory Utilization tab to view information about the memory utilization of each app running in the environment, including:
-
Memory Utilization: The amount of the heap memory used by the JVM.
-
Total Memory: The total size of the app’s heap memory.
-
Memory Pressure: The percentage of heap memory in use, calculated as memory used divided by total memory.
| This tab isn’t available to apps in hybrid standalone deployments. |
Export a Report as a CSV
Export a report on all apps in the selected tab as a CSV file.
-
Navigate to a report.
For guidance, see Access Reports.
-
Click Export CSV to download the CSV file.