Configuring Singlestats in a Custom Dashboard
Configure singlestat charts for Mule apps and APIs in an Anypoint Monitoring custom dashboard. A singlestat chart displays a single value, such as the value of an Inbound - Average Request Count by Endpoint metric.
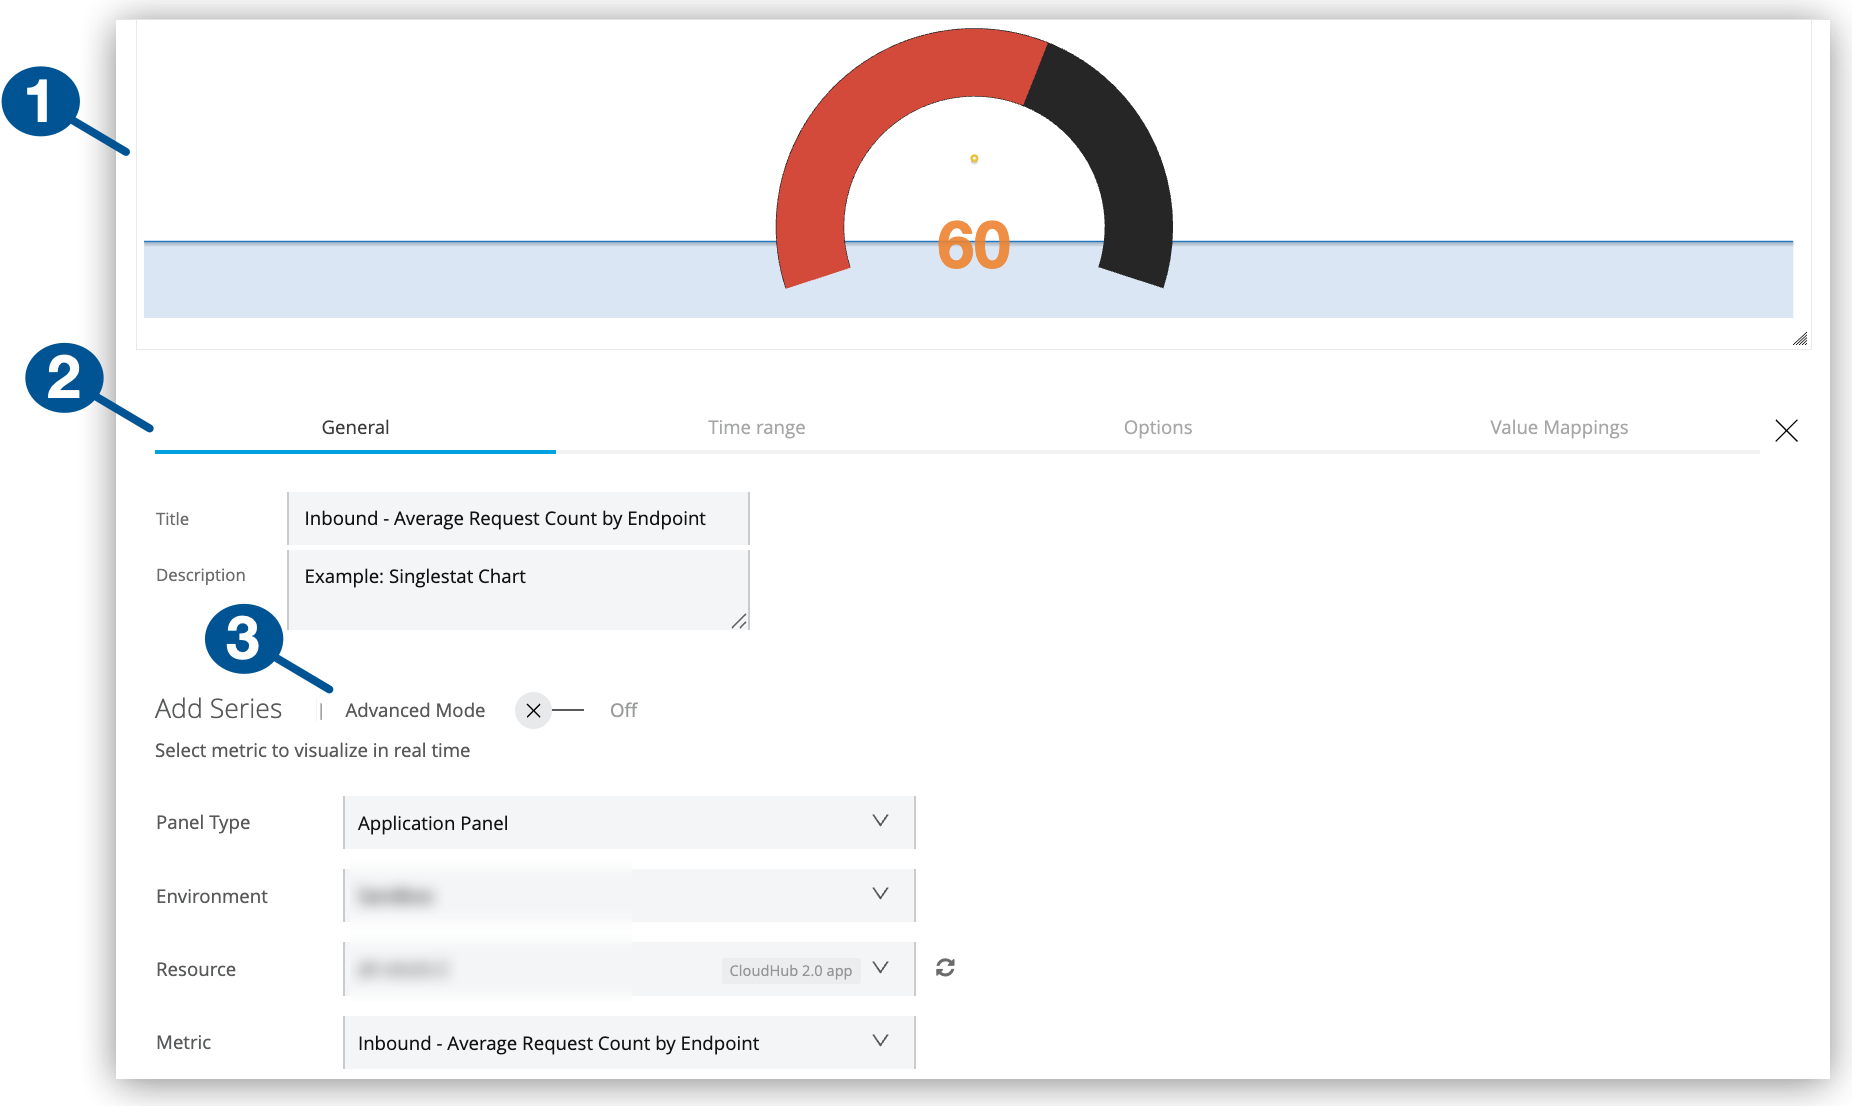
| 1 | A singlestat chart example
You can customize the look of singlestats. |
| 2 | Singlestat configuration tabs:
|
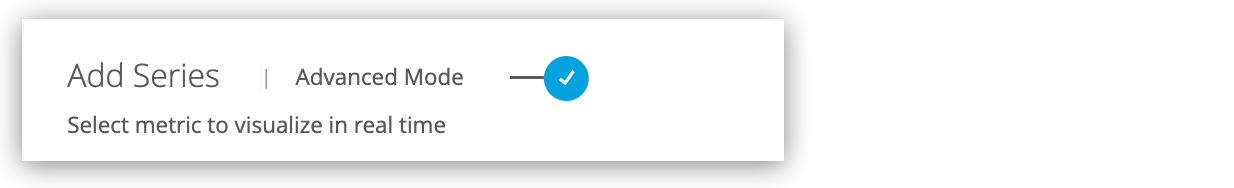
| 3 | Advanced Mode: Switch for enabling advanced configurations |
Create a Singlestat Chart
Create a singlestat chart in a custom dashboard by following the guidance in Add Charts to a Custom Dashboard.
Configure a Singlestat Chart
Configure a singlestat chart in a custom dashboard.
-
From Custom Dashboards, open the custom dashboard that contains your singlestat chart.
For guidance, see View a Custom Dashboard.
-
Click the singlestat’s
 (More menu), and select Configure.
 -
Click the singlestat’s General configuration tab.
-
Provide a title and description.
-
Select and configure a singlestat mode (basic or advanced).
Both modes require environment, resource (app or API), and metric settings. For more information, see General Settings for Basic and Advanced Queries.
-
-
Optionally:
-
In the singlestat’s Time range tab, set the singlestat’s overrides for the time range selected by users.
-
In the Options tab, configure singlestat fonts, coloring, spark lines, and other style settings.
-
In the Value Mappings tab, provide a human-readable label for a summary statistic.
-
-
Click Apply Changes.
-
Exit the configuration view by clicking the X next to the configuration tabs.
General Settings for Basic and Advanced Queries
General tab settings include basic and advanced modes (or queries) for configuring time-series data. Both configurations share fields for the title and a short description.
| Basic and Advanced Mode Settings | |
|---|---|
Title |
Title to display in the UI. Defaults to Panel Title. |
Description |
Short description to display in the UI when users hover over the information ( |
Other settings are specific to the setting mode (basic or advanced).
Basic Mode
In the General configuration tab, a basic query selects a single metric for a deployed Mule app or API in a given environment.
| Basic Mode Settings | |
|---|---|
Panel Type |
From the drop-down menu, select the type of panel to display for the resource (Application Panel or API Panel) |
Metric |
The drop-down menu includes these types of metrics:
For a list of basic metrics, see Basic Mode Metrics |
Environment |
The environment where your application or API is deployed. |
Resource |
A deployed application. This option is available if you select Application Panel as your panel type. |
API |
A deployed API. This option is available if you select API Panel as your panel type. |
Version / Instance |
The Mule version or instance on which your API is deployed. This option is available if you select API Panel as your panel type. |
| When you create an application panel using a JVM metric, the query that supports the panel uses only the worker-id for the app. When you modify the panel at a later time, the resource fields are populated with the query content. Because some apps share a worker-id, the resource that appears in the selector might appear to be a different resource from the resource you selected originally. However, all resources share the same worker, so the query has the correct information despite the selector displaying a different resource name. |
Advanced Mode
In the General configuration tab, advanced mode settings support fine-tuned queries for metrics.
| If you switch back to basic mode, some advanced configuration queries are removed. |
| Advanced Mode Settings for Applications | |
|---|---|
From |
Lists metrics, such as This field provides matching suggestions when you type in a character. For example, For a list of advanced metrics, see Advanced Mode Metrics |
Where |
Supports conditional logic for filtering the From metric you selected.
Grouping |
Select |
Add one or more metric |
Group By |
For grouping the data by a selected time interval (such as Valid values and arguments:
|
Alias By |
You can create a label for your metric using a literal string (such as |
| Advanced Mode Settings for APIs | |
|---|---|
From |
Lists metrics, such as For a list of advanced metrics, see Advanced Mode Metrics |
Where |
Provides conditional logic for filtering the metric selected from the From field. You can select one or more filter tags (such as |
Select |
For creating a function that selects a metric field (such as |
Group by |
For grouping the data by a selected time interval (such as
|
Alias by |
You can create a label for your metric using a literal string (such as To use your tag as an alias, the tag must be included in the |
Time Range (Overrides, Time Shifts, Info Display)
Time range configurations provide a way to override relative time ranges (such as the last 30 minutes) selected from the dashboard UI by end users.
| Time Range Settings | |
|---|---|
Override Relative Time |
The amount of time covered by the statistic, for example, the last hour ( |
Add Time Shift |
How long ago the covered time range ended, for example, |
Hide Time Override Info |
Hides information about the override time range settings from the singlestat or table, such as |
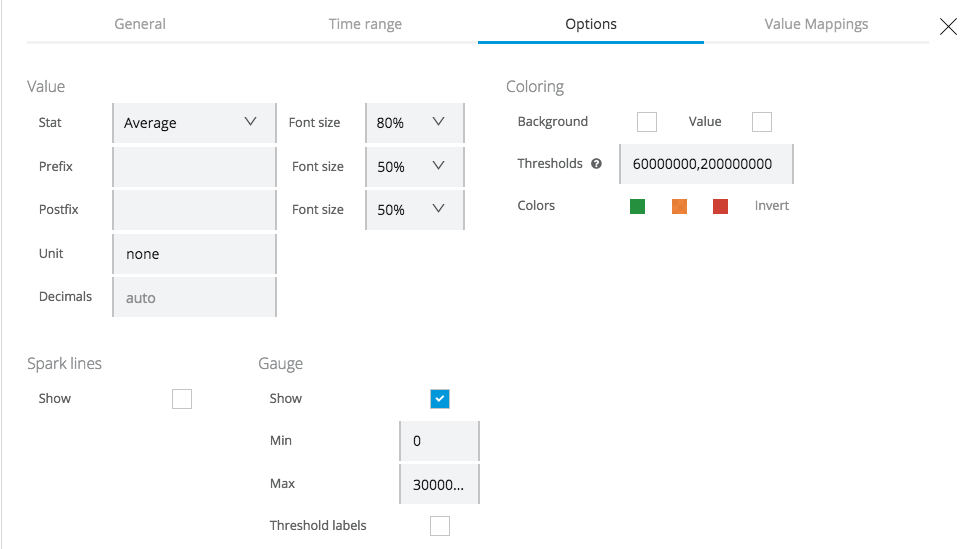
Options Tab
The Options tab includes settings for singlestat values, fonts, coloring, spark lines, and gauge icon settings.
Value Settings for Singlestats
Configure values for your singlestat. Value settings include the type of value you want (such as an average), the unit of measure, and others.
| Values | |
|---|---|
Stat |
The value displayed by the singlestat. Available Settings:
|
Prefix |
Prepends text to the singlestat value. |
Postfix |
Appends text to the singlestat value. |
Unit |
Unit of measurement to display with the singlestat value (for example, |
Decimals |
Overrides the automatic decimal precision for the legend and tooltips. |
Font size |
Select the font size for the stat, prefix, and postfix. |
Coloring and Thresholds
Add color-coded thresholds to a singlestat so that you can see whether it exceeds or stays within expected limits.
| Coloring | |
|---|---|
Background |
Adds a background color determined by the Thresholds setting. |
Value |
Applies a color for the current singlestat value that matches the color determined by the Thresholds setting. |
Thresholds |
Sets a threshold using a numeric range such as |
Colors |
Sets the colors for the values that are below, within, or above the Thresholds settings. You can invert the colors, as needed. |
Spark Lines
Configure spark line settings to show a visual representation of the data.
| Spark Lines | |
|---|---|
Show |
Checkbox to show or hide the spark line. |
Full Height |
For covering the full height of the singlestat. |
Line Color |
For selecting the color of the spark line. |
Fill Color |
For selecting the color of the area below the spark line. |
Gauge
Display an arc-like gauge that represents the value of the singlestat.
| Gauge | |
|---|---|
Show |
Checkbox for showing or hiding the gauge. |
Min |
Sets a minimum value (such as |
Max |
Sets a maximum value (such as |
Threshold Labels |
Checkbox for showing or hiding your Threshold settings. |
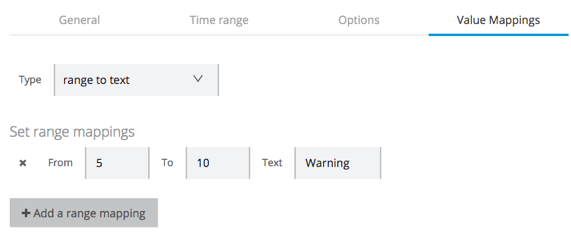
Value Mappings
From the Value Mappings configuration tab, you can provide a human-readable label for a summary statistic.
| Range to Text Settings | |
|---|---|
Value to Text |
Maps a number to a textual description, for example: |
Range to Text |
Maps a numeric range to a textual description, for example: From |